
Just a quick post today to follow the progress of the possible H&S patterns forming on SPX and QQQ.
In my post on the morning of Wednesday 30th July I was looking at the pattern setups on SPX, QQQ and DIA and saying that these delivered a very nice setup for at least a short time high forming there.
In my post on the morning of Friday 1st August I was looking at the first real signs of weakness on the US equity indices since the April low after the strong breaks of the daily middle bands on DIA and IWM on Thursday, and saying that confirmation was needed with further breaks of the daily middle bands on SPX and QQQ.
In my post on Sunday 3rd August I was looking at the strong breaks of the daily middle bands on SPX and QQQ on Friday and the closes well below the 3sd daily lower bands on DIA and IWM. I proposed a rally early this week to backtest the daily middle bands on SPX and QQQ while setting up high quality H&S right shoulders on both.
In my post yesterday I was looking at the modest breaks back over the daily middle bands on SPX and QQQ on Monday and noting that conversion of those to support would open possible all time high retests and hard fails there would strongly support the H&S patterns forming on both.
So we are still in the short term inflection point I was looking at yesterday but the close yesterday leans bearish, with both SPX and QQQ failing to confirm their breaks back above their daily middle bands. This is encouraging for the H&S patterns on both playing out but obviously they both need to continue to fail at the daily middle bands and to start heading back to Friday’s lows.
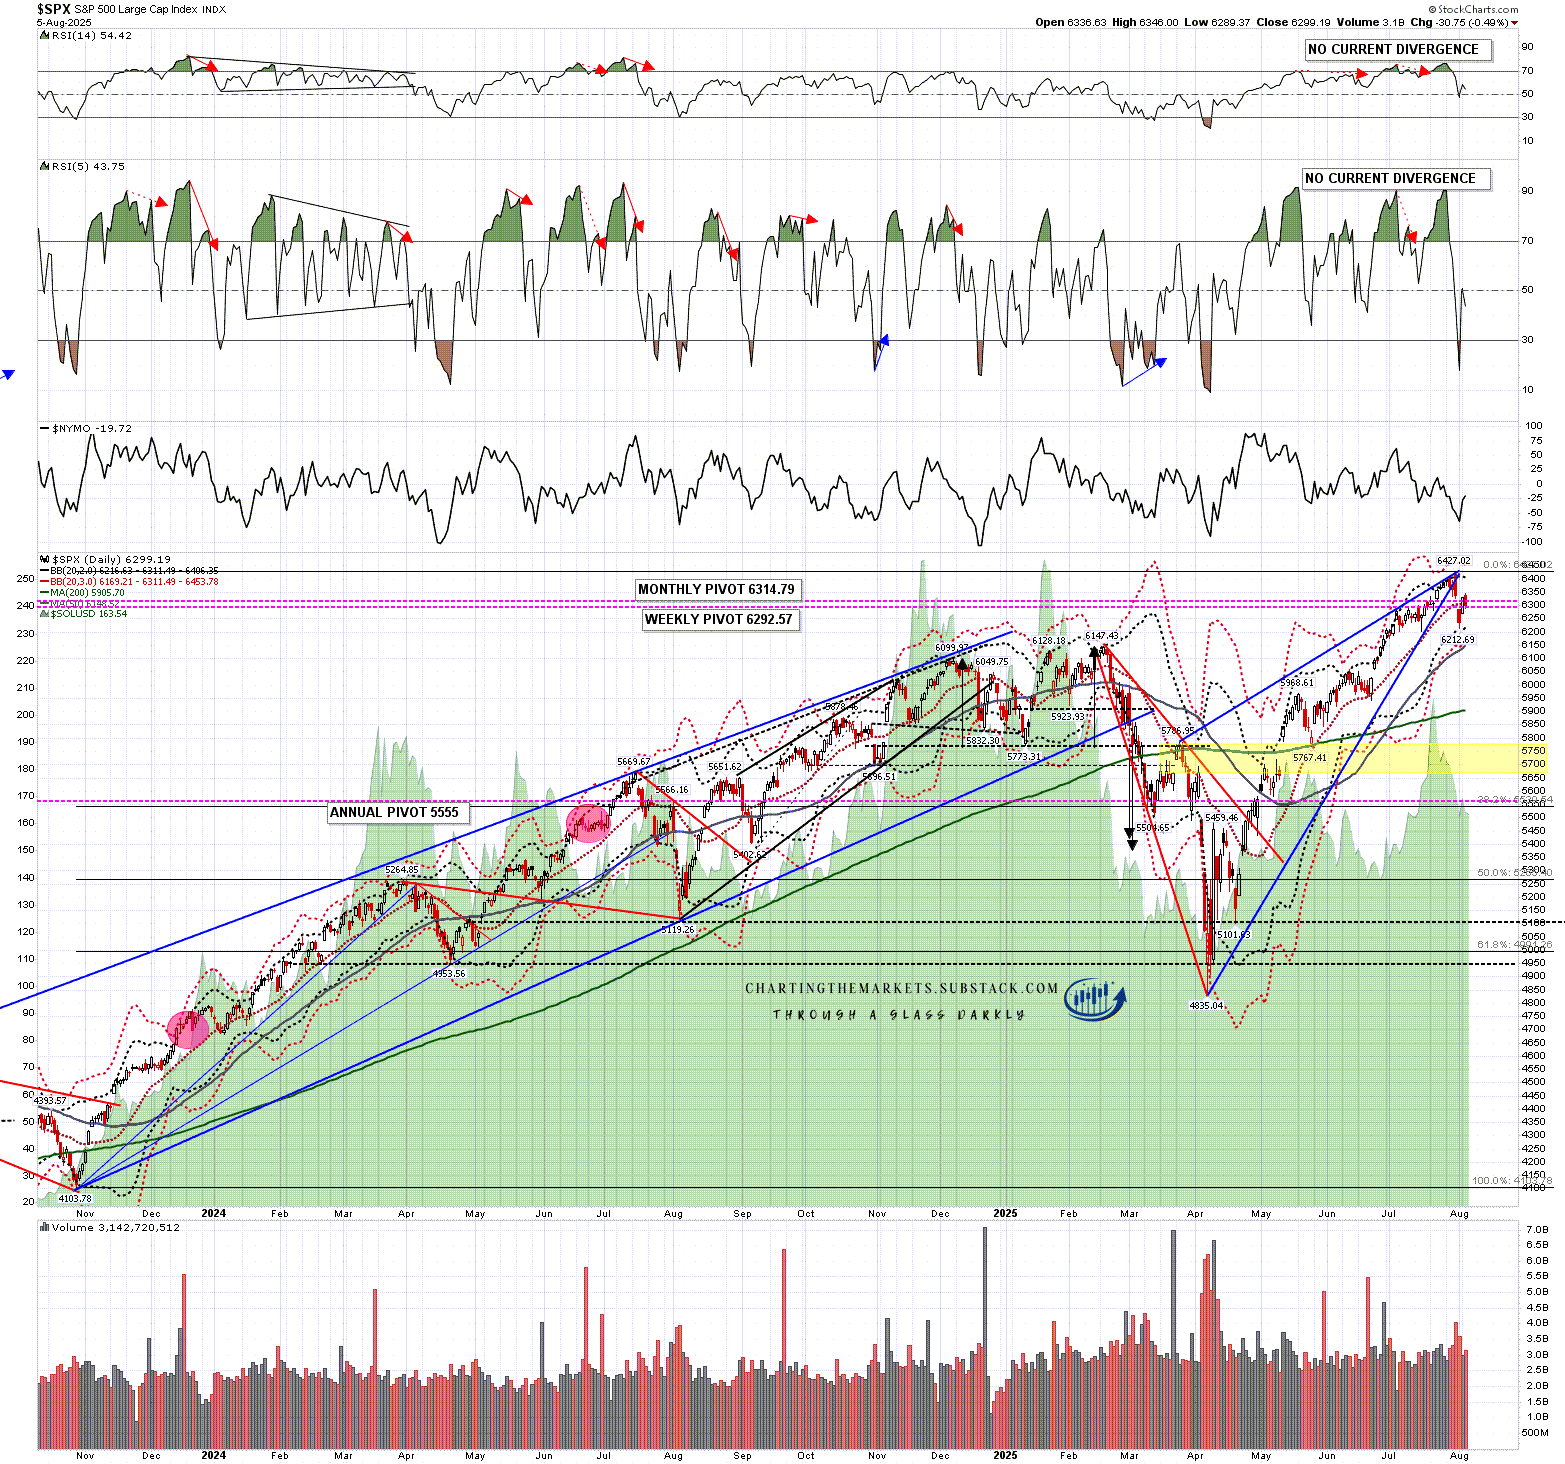
On the SPX chart the close yesterday was at 6299.19, clearly back below the daily middle band which closed at 6311.49.
SPX daily chart:
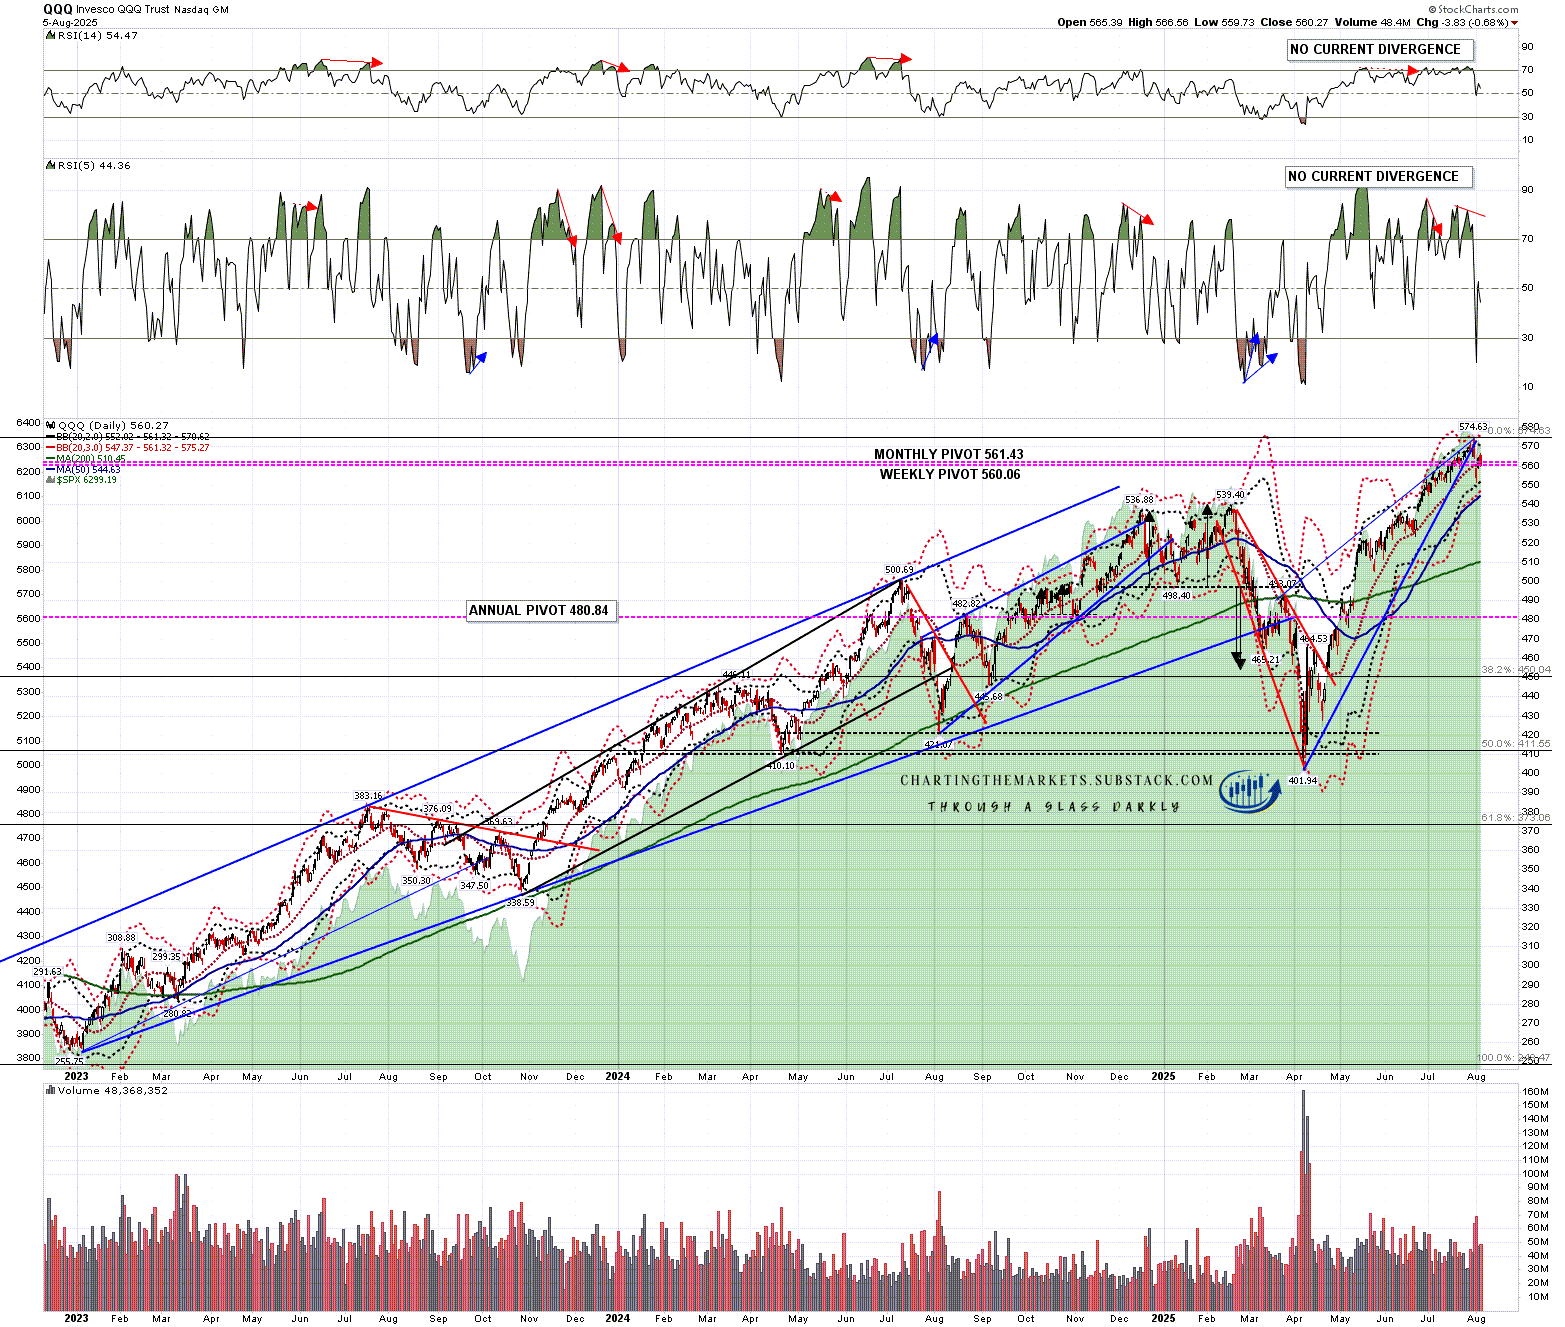
On the QQQ chart the close yesterday was at 560.27, clearly back below the daily middle band which closed at 561.32.
QQQ daily chart:
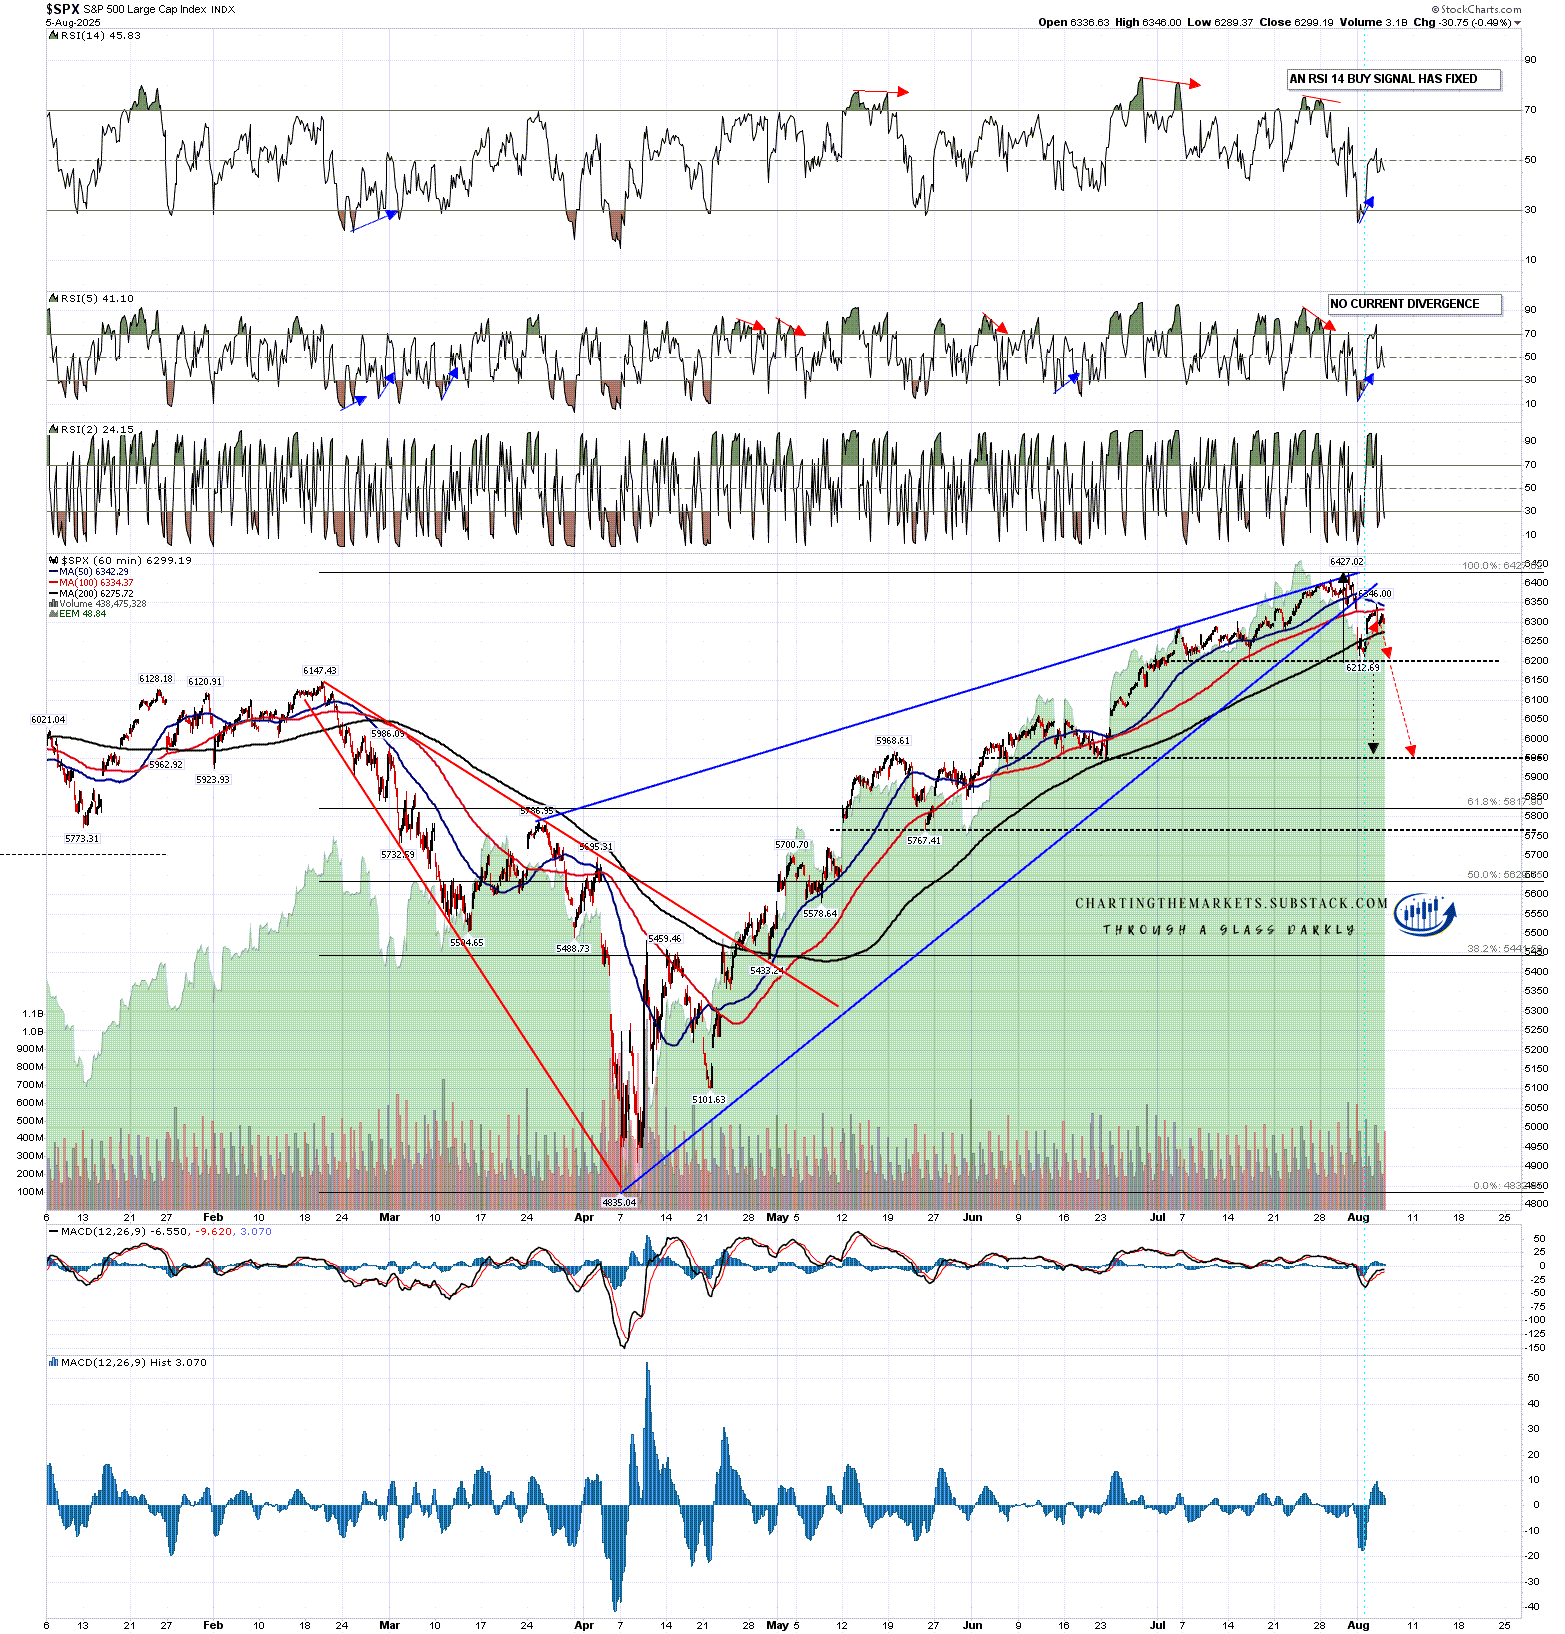
The H&S setup on SPX is high quality. A return to the neckline in the 6214 area would complete the H&S and a sustained break below that would look for a target in the 5990-6000 area, not far above the possible larger H&S neckline in the 5950 area.
SPX 60min chart:
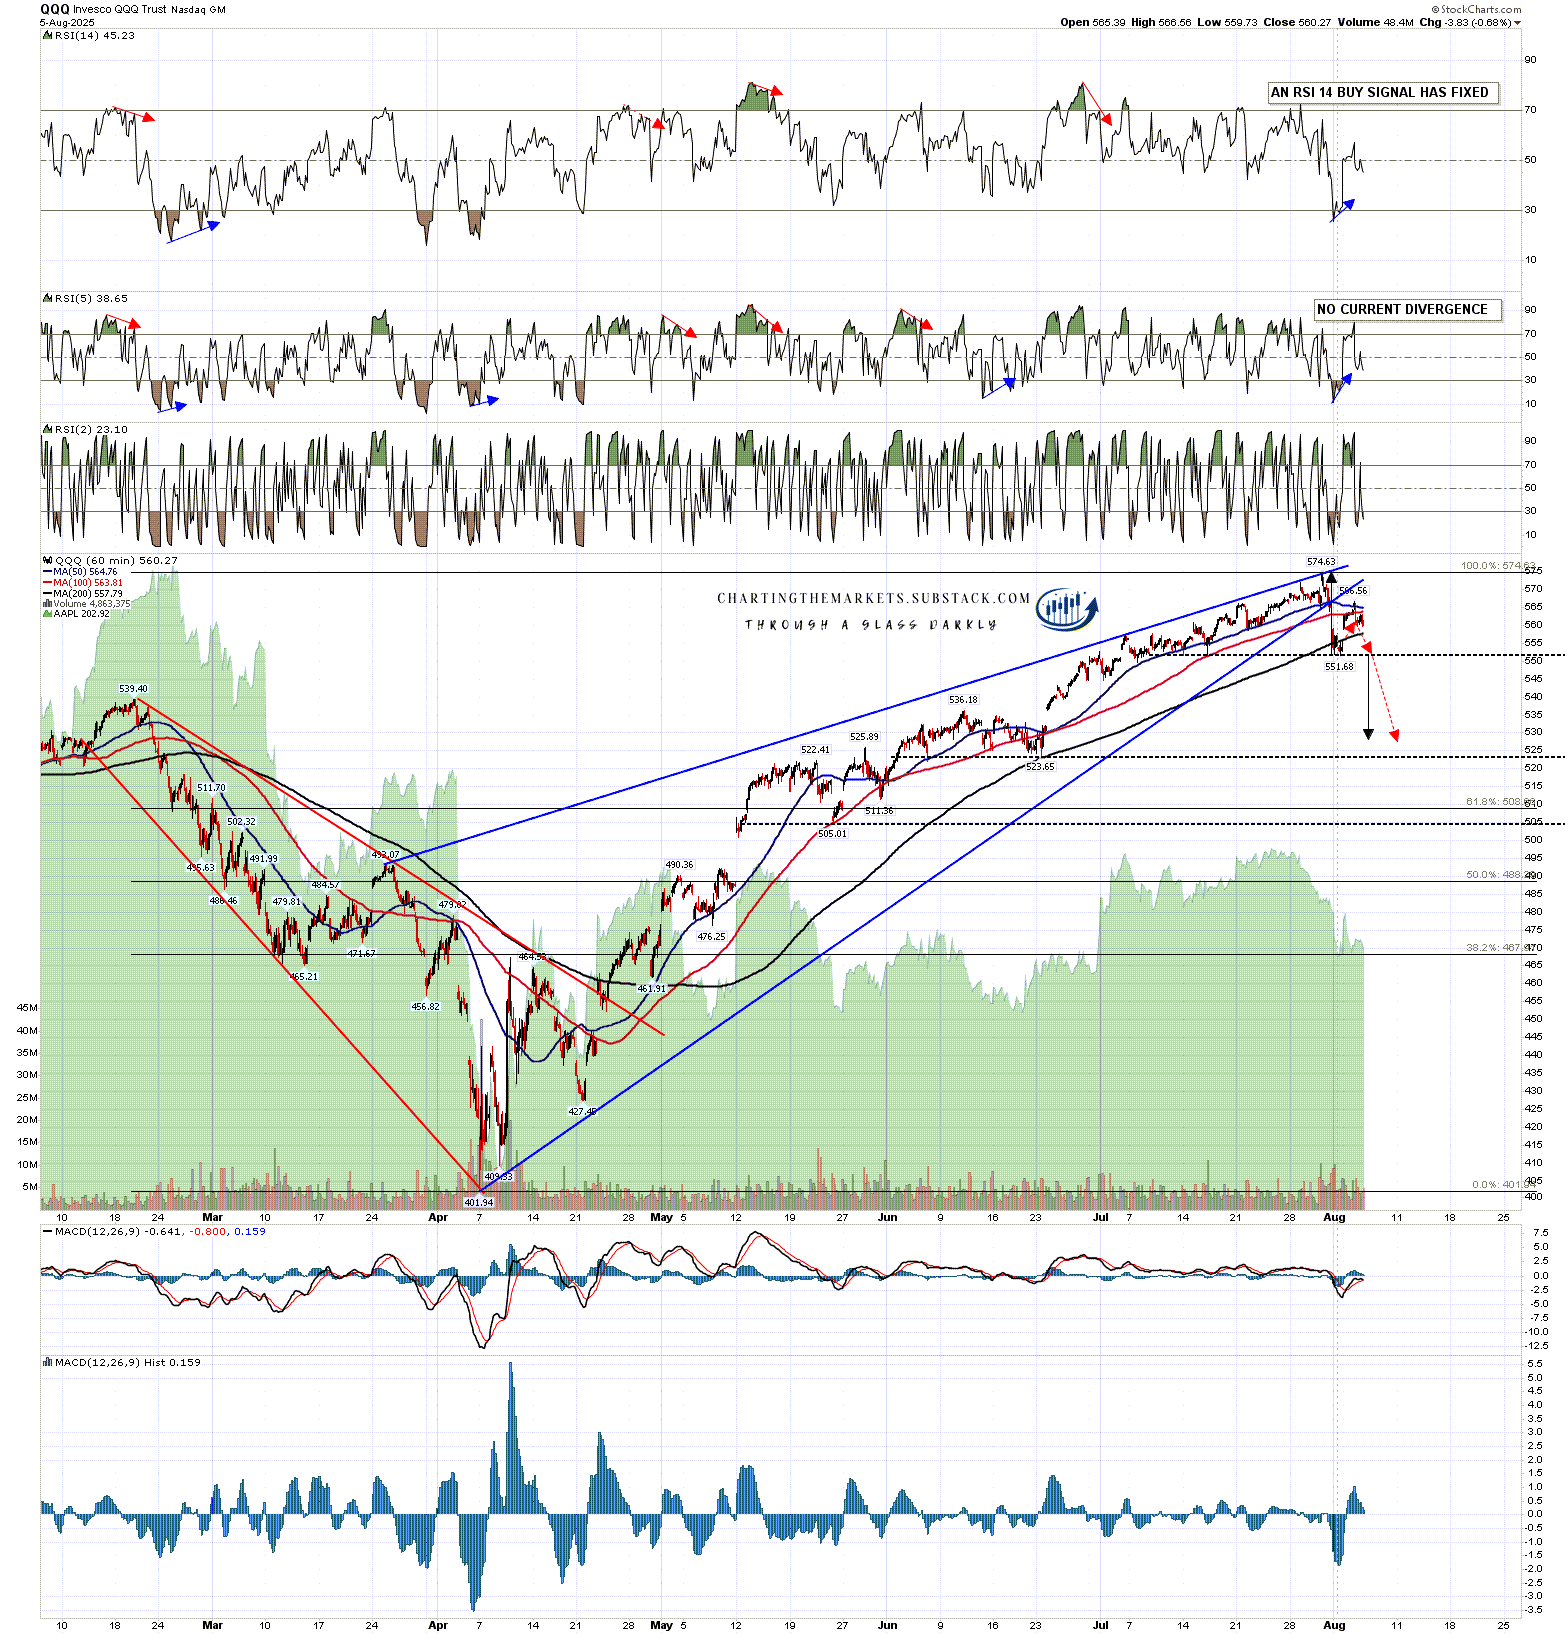
The H&S setup on QQQ is also high quality. A return to the neckline in the 551 area would complete the H&S and a sustained break below that would look for a target in the 528-9 area, not far above the possible larger H&S neckline in the 523-4 area.
QQQ 60min chart:
I think equity indices are in the early stages of a significant retracement here that will ideally retrace around 50% of the move up from the April lows before (probably) retesting the current highs. That will likely be the case whatever happens at this short term resistance point.
In the short term I’m now leaning 75% towards a break down directly from this inflection point. We’ll see how that goes over the rest of this week.
If you like my analysis and would like to see more, please take a free subscription at my chartingthemarkets substack, where I publish these posts first. I also do a premarket video every day on equity indices, bonds, currencies, energies, precious commodities and other commodities at 8.45am EST, but only for paying subscribers. Other places to find me are my twitter, and my Youtube channel.
No comments:
Post a Comment